What are the key performance characteristics of Australia’s current and planned light rail systems and what are the prospects for their future expansion, as well as for the development of new lines and systems?
This is the focus of this final post in a three-part series on Australia’s current light rail systems in Adelaide (Glenelg Tram), Sydney’s inner west (Dulwich Hill line) and the Gold Coast, along with the second line planned for Sydney (CBD and Eastern Suburbs Light Rail – CESLR) and the line planned for Canberra. I have not included Melbourne’s tram system in these discussions because that system’s sheer size and the fact that it is based predominantly on street-running tramlines rather than separated light rail corridors make comparisons difficult.
In the first of this series I introduced the light rail systems and compared their history and current status, while in the second I looked at their technical features and construction costs. In this post I’ll discuss aspects of their performance such as speed, capacity and patronage, outline any proposals for expansion and provide some concluding comments regarding the future of light rail. A lot of the statistical material in all three posts I have also summarised in this table, which is also available in a printable A4 2-page version.

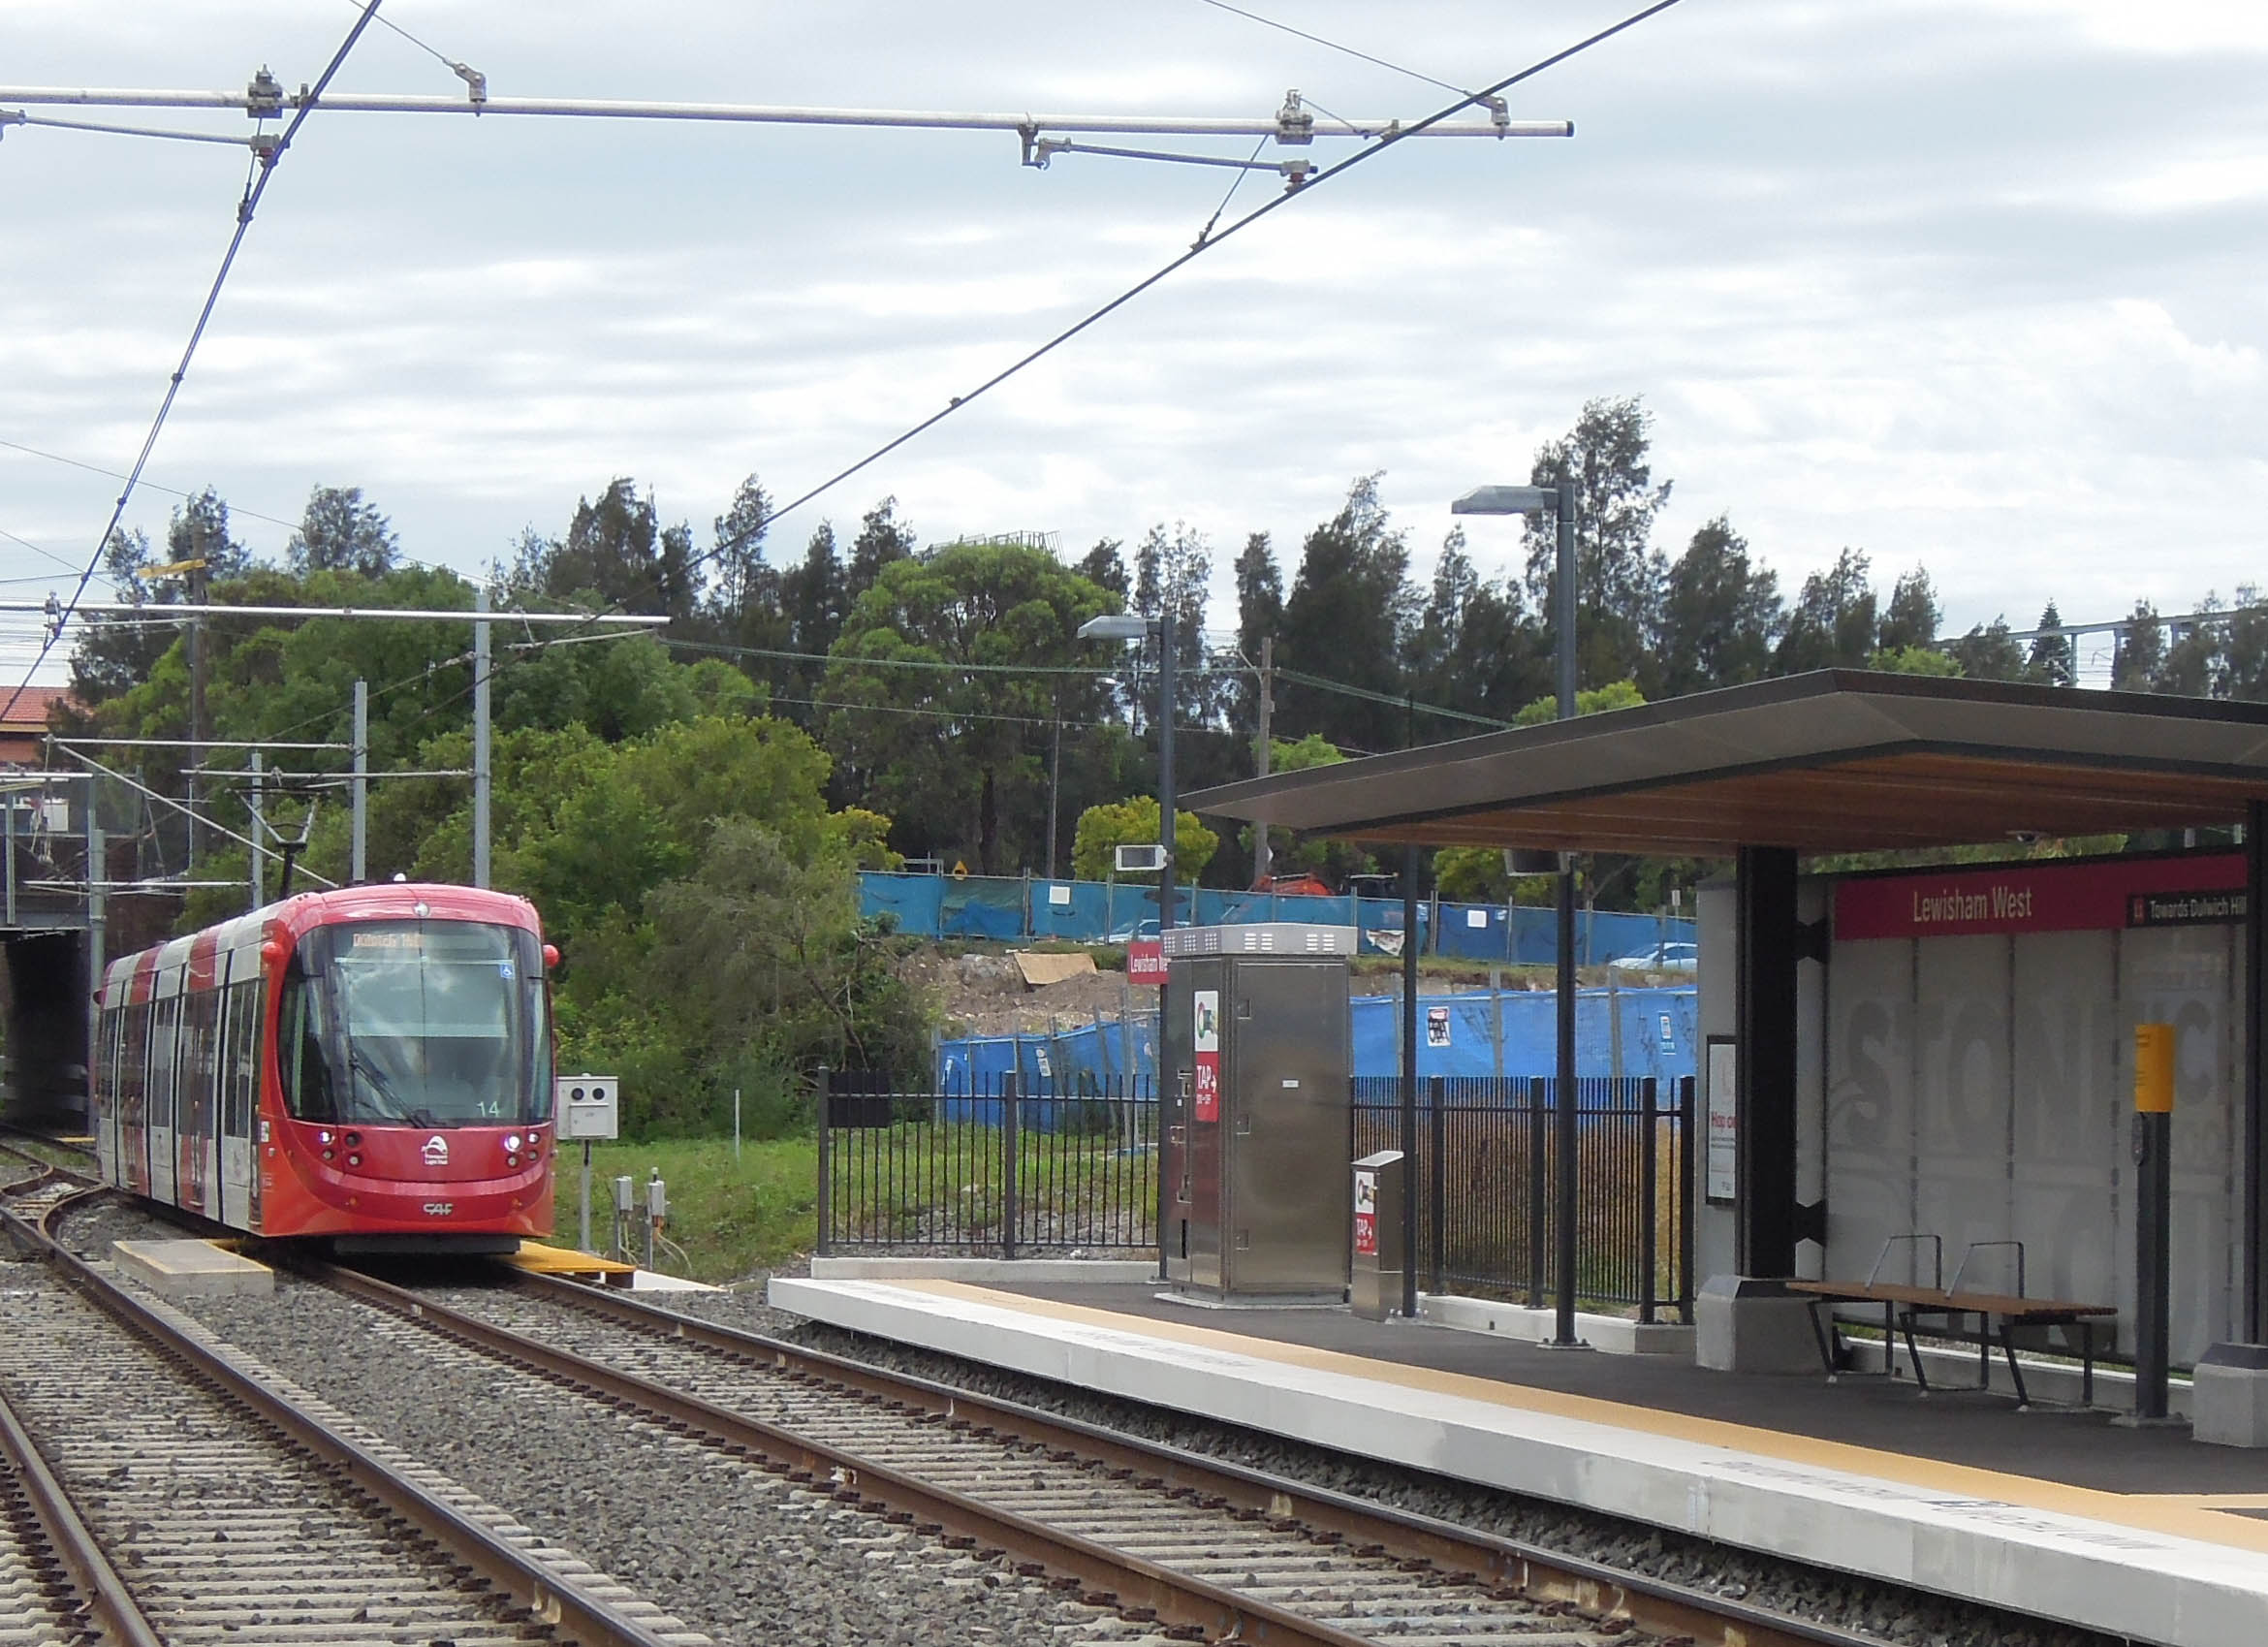
Sydney Light Rail – Dulwich Hill (Inner West) Line and proposed CESLR Line
Average trip speed: The average trip speed for the current systems is based on an examination of their timetables, and for the purpose of comparison I have used morning peak trip times for the current systems. For the planned systems I have used the estimates provided in relevant planning documents of end-to-end trip times divided by the length of the line.
The number and spacing of stops is likely to affect speed so out of the current lines it is no surprise that the Adelaide system is the slowest at 16.4kph, given it has the most frequent stops. It is followed by Sydney’s Dulwich Hill line (19.7kph) while the Gold Coast line, which has the most widely-spaced stops, is the fastest at 23.6kph. What is more interesting is the range in the anticipated trip speeds provided by the two planned lines in comparison to the current lines and each other. Sydney’s CESLR will be the slowest of any of the systems with an average speed of only 13.8kph, while the proposed Canberra line will be the fastest at 28.8kph – more than twice the speed of the CESLR.

Adelaide Glenelg Tram Line map
There are several explanations for this discrepancy. One is that the stops on the planned Sydney line are 667m apart while those on the proposed Canberra line are the furthest apart of any system at an average of 1,000 metres. Perhaps more significantly the Sydney line is planned to have much greater utilisation than the other lines (this will be discussed later) which means that dwell times at stops are likely to be longer. This line will also have a shared pedestrian section one kilometre long through which maximum speeds will be limited.
Service frequency: Two measures have been used here – average daytime off-peak frequencies and those in the peak period. To derive these I have used a mix of stated frequencies and my own estimates based on published timetables.
Three systems – the Adelaide line, Sydney’s Dulwich Hill line and the proposed line in Canberra – have (or will have) average daytime hourly off-peak 15-minute frequencies, or four vehicles an hour. The Gold Coast line has twice this frequency at 7.5 minutes, or eight vehicles per hour, while Sydney’s planned CESLR line will have five minute off-peak frequencies, or 12 vehicles an hour.
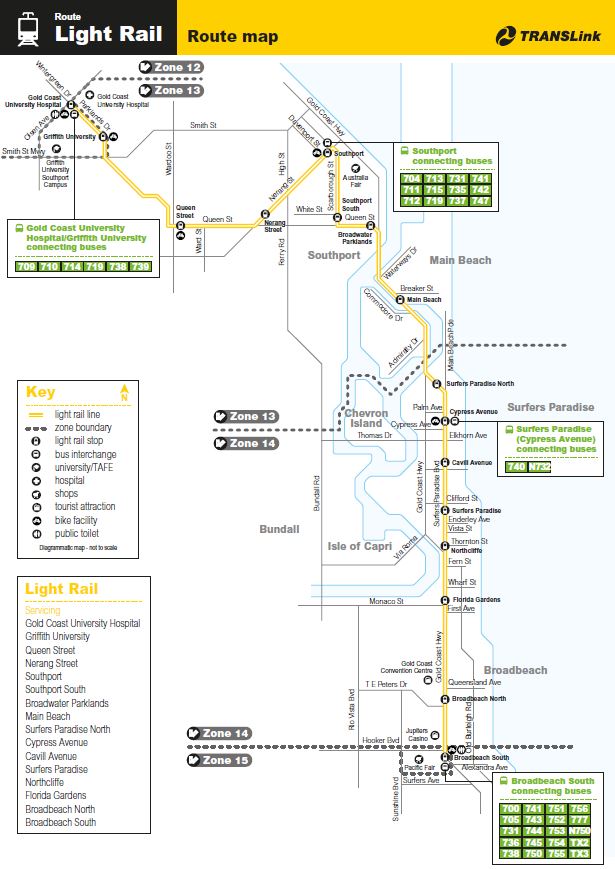
Gold Coast Light Rail Line route map
Peak hour frequencies are closer together. The Dulwich Hill line in Sydney has 10-minute frequencies (six vehicles an hour) while the Adelaide line has frequencies of between five to 10 minutes (6-12 vehicles per hour). The Gold Coast line currently has 7.5 minute frequencies (eight vehicles) while the Canberra line is planned to have six-minute frequencies (10 vehicles). As with off-peak frequencies, Sydney’s CESLR line will have the most frequent peak hour service at four minutes or 15 vehicles an hour.
Peak hour capacity: There are a number of different ways of measuring this, but probably the most critical is maximum capacity during the peak period. In turn there are several ways this can be defined, but one approach is to determine the maximum capacity over one hour in the morning peak period in the direction with the greatest frequency of services.
In some cases the frequency may be the same in both directions while in others services running towards the CBD will have the greatest frequency. This calculation is therefore based on the number of vehicles per hour in the chosen direction, multiplied by the average maximum capacity of the vehicles in each light rail fleet. Because of the range of variables involved the results are somewhat arbitrary I have not included them in the table referenced earlier.
Bearing this in mind, the results are illuminating. Sydney’s Dulwich Hill line has the lowest maximum capacity at 1,200 passengers (plans to increase this appear to have been postponed). Adelaide has a maximum of 2,160 passengers (based on five-minute frequencies) and the Gold Coast slightly more at 2,400 passengers per hour. The LR vehicle type to be used in Canberra is yet to be finalised but based on the options available the maximum capacity is likely to be in the range 2,000 to 3,000 passengers per hour.
Sydney’s planned line is significantly different however, with a maximum of 6,750 passengers per hour, more than double that of any other line. This is not only because the CESLR line will have the highest peak hour frequency of all the systems but also because the services will be provided by vehicles running in pairs carrying up to 450 passengers between them. Thus Sydney will be home to the lines with the greatest and least capacity.
Patronage: While patronage figures have been included in the table they are also subject to some qualification. The Adelaide figures appear to include original boardings only and not transfers. In the case of the Dulwich Hill line only three months of operation of the most recent extension is included in the most recent annual patronage figures; similarly the Gold Coast line annual estimates are based on only nine months’ operation. In addition the increases in passenger numbers since the new infrastructure was opened in both Sydney and the Gold Coast have exceeded the figures forecast in the relevant planning documents. Of course the figures for the planned lines in Sydney and Canberra are estimates.
Two figures are quoted in the table – the most recent annual patronage total (or forecast, in the case of the planned systems) and the average per day. The latter is calculated simply by dividing the former by 365 days and does not take into consideration any variation between weekdays, weekends or public holidays.

Canberra proposed Capital Metro Light Rail Line map
On this basis, Adelaide has the lowest passenger numbers (2.3 million annually or an average of 6,300 per day) followed by Sydney’s current Dulwich Hill line (3.9 million or 10,700 per day), the estimate for Canberra (5.5 million or 15,000 per day) and the Gold Coast (6.3 million or 17,300 per day). By far the biggest number however is the patronage projected for Sydney’s CESLR line, which is estimated will be 31.4 million or 84,900 per day). This is five times the annual estimate of the line which currently has the greatest levels of utilisation, the Gold Coast light rail (the CESLR patronage estimates will be the subject of a separate article).
Utilisation: Another way to look at passenger use is to calculate the number of hours of operation at peak capacity it would take to move the daily patronage total (or estimate) in one direction. The result is a highly artificial figure (which is why it is not included in the table) as obviously usage is spread unevenly throughout the day with trips in both directions, but it does provide some useful insights into system utilisation.
Adelaide’s system is comparatively modestly utilised as it would require only three hours at current peak hour capacity levels to move the daily total of passengers. The planned Canberra line would need between five and 7.5 hours, the Gold Coast line just over seven hours and Sydney’s Dulwich Hill line nearly nine hours. The planned Sydney CESLR is again the outlier, requiring over 12.5 hours of running at maximum capacity (in one direction) to move a day’s worth of passengers.
Extension and expansion options: There are a number of expansion plans for all of these lines, though some would seem to have more support than others. The line with the best prospects of extension in the near future is the Gold Coast line where the need to connect the line to the heavy rail network has been recognised as a high priority. There are long-term plans to extend the Adelaide line to the north-east as part of the long-term development of an ambitious light rail network but these are as yet unfunded.
Extensions have also been proposed for the yet-to-be-built Sydney CESLR and Canberra lines, though these are obviously contingent on the completion of the lines themselves. While the Dulwich Hill line in Sydney is unlikely to be extended and there are no definite plans for its expansion there is a suggestion that a spur line could be constructed as part of a large residential redevelopment.
Concluding comments: After decades in which the only light rail or tram line outside Melbourne was a solitary line in Adelaide running 1920s rolling stock, the revival of light rail in Australian cities was slow to start but gathered momentum over the last five to 10 years, drawing on the increase in passenger numbers and the other positive outcomes of each successive project. The question now is whether this momentum can be maintained.
In the short term the outlook appears positive with two ambitious projects on the drawing board. The first and by far the biggest is Sydney’s CBD and Eastern Suburbs Light Rail line which as noted earlier will carry an estimated 31.4 million passengers annually, displacing hundreds of buses which currently fill Sydney’s CBD in peak hour. The second would be Canberra’s first LR line, Capital Metro.
Both these lines have received major criticism however, partly because of their position at different ends of the light rail scale. I have discussed some of these issues in relation to Sydney’s CESLR and will return to this in a later post, but it is clear that for much of the day this line will need to run at close to maximum capacity and indeed close to the maximum that light rail can carry. On the other hand while Canberra’s line has reasonable if significantly more modest passenger projections, the argument has been made that the city’s dispersed settlement and low density development might be better suited to a bus rapid transit network.
As a result, while the fact that a contract has been signed for the CESLR in Sydney means this line is therefore almost certain to proceed, the prospects for Canberra’s Capital Metro are much more precarious. They depend largely on the outcome of the next ACT elections due next year, with the opposition vowing to scrap the project if elected.
The success of the existing lines has also led to proposals for a number of other projects around Australia, though as they have not yet been committed to by various governments and/or are at the early planning stage they were not considered in this series of posts. Of these the lines proposed as the heavy rail replacement in the centre of Newcastle in NSW and to improve transport around Parramatta, also in NSW, seem the most likely to proceed.
The story with the lines proposed in other states is much more mixed. The Northern Suburbs Railway in Hobart appears to have no formal political support while the MAX network proposal in Perth and the light rail extensions in Adelaide have stalled due to funding issues. It may be that the nascent “boom” in light rail projects will end with the CESLR and other potential lines in NSW.
The funding of light rail infrastructure is a crucial issue, especially with current Federal Government’s decision to withdraw from providing financial support to urban public transport. The previous government’s contribution was critical to the construction of Gold Coast light rail, as it was in relation to heavy rail projects elsewhere. At this stage it appears that despite the apparent success of light rail only NSW appears prepared to go it alone with new projects in the absence of Federal funding support, at least in the short term.