This is the second in a series of articles regarding the recent growth of interest in light rail in Australian cities which has led to the extension of lines in Adelaide and Sydney, the development of a completely new line in the Gold Coast as well as firm plans for an additional line in Sydney and a new line in Canberra. In the first post in this series I outlined some of the key features of these lines and provided a table comparing them which is also available here in a more printer-friendly A4 version.
I’m continuing the discussion in this post by looking at some of the key technical features of the current and proposed systems as well as their cost, again referencing in the statistics in this table. As noted in my last post I haven’t included the extensive Melbourne tram system in this comparison, which specifically looks at light rail lines (as opposed to street-running tram systems) which have been extended or opened since 2010 or which are planned to open within the next five years.
Total route length: One thing these lines have in common is that they all have similar route lengths of between 12 and 15 kilometres. The proposed CBD and Eastern Suburbs Light Rail (CESLR) in Sydney is actually only nine kilometres long from the city terminal at Circular Quay to the ends of its two branches (this is the only line with branches) but it has a total route length of 12 kilometres. The longest line at 15 kilometres is the Glenelg tram in Adelaide.
Both Adelaide’s Glenelg and Sydney’s Dulwich Hill lines happen to be based on the conversion of existing rail corridors that were both about 12 kilometres long, but the consistency in route length isn’t entirely coincidental. This distance seems to suit light rail; shorter distance routes (especially those with more frequent stops) are probably better suited to buses or street-running trams, while heavy rail is more appropriate for longer corridors with higher speeds and less frequent stops.
The economics involved in securing land and the upfront costs involved in the infrastructure for new fixed rail corridors also tend to favour heavy rail over longer distances. That said, there is plenty of overlap in terms of the corridor lengths for bus, tram, light rail and heavy rail routes. In addition extensions planned for some of these lines may take them past the 15 kilometre “limit” of the current systems.
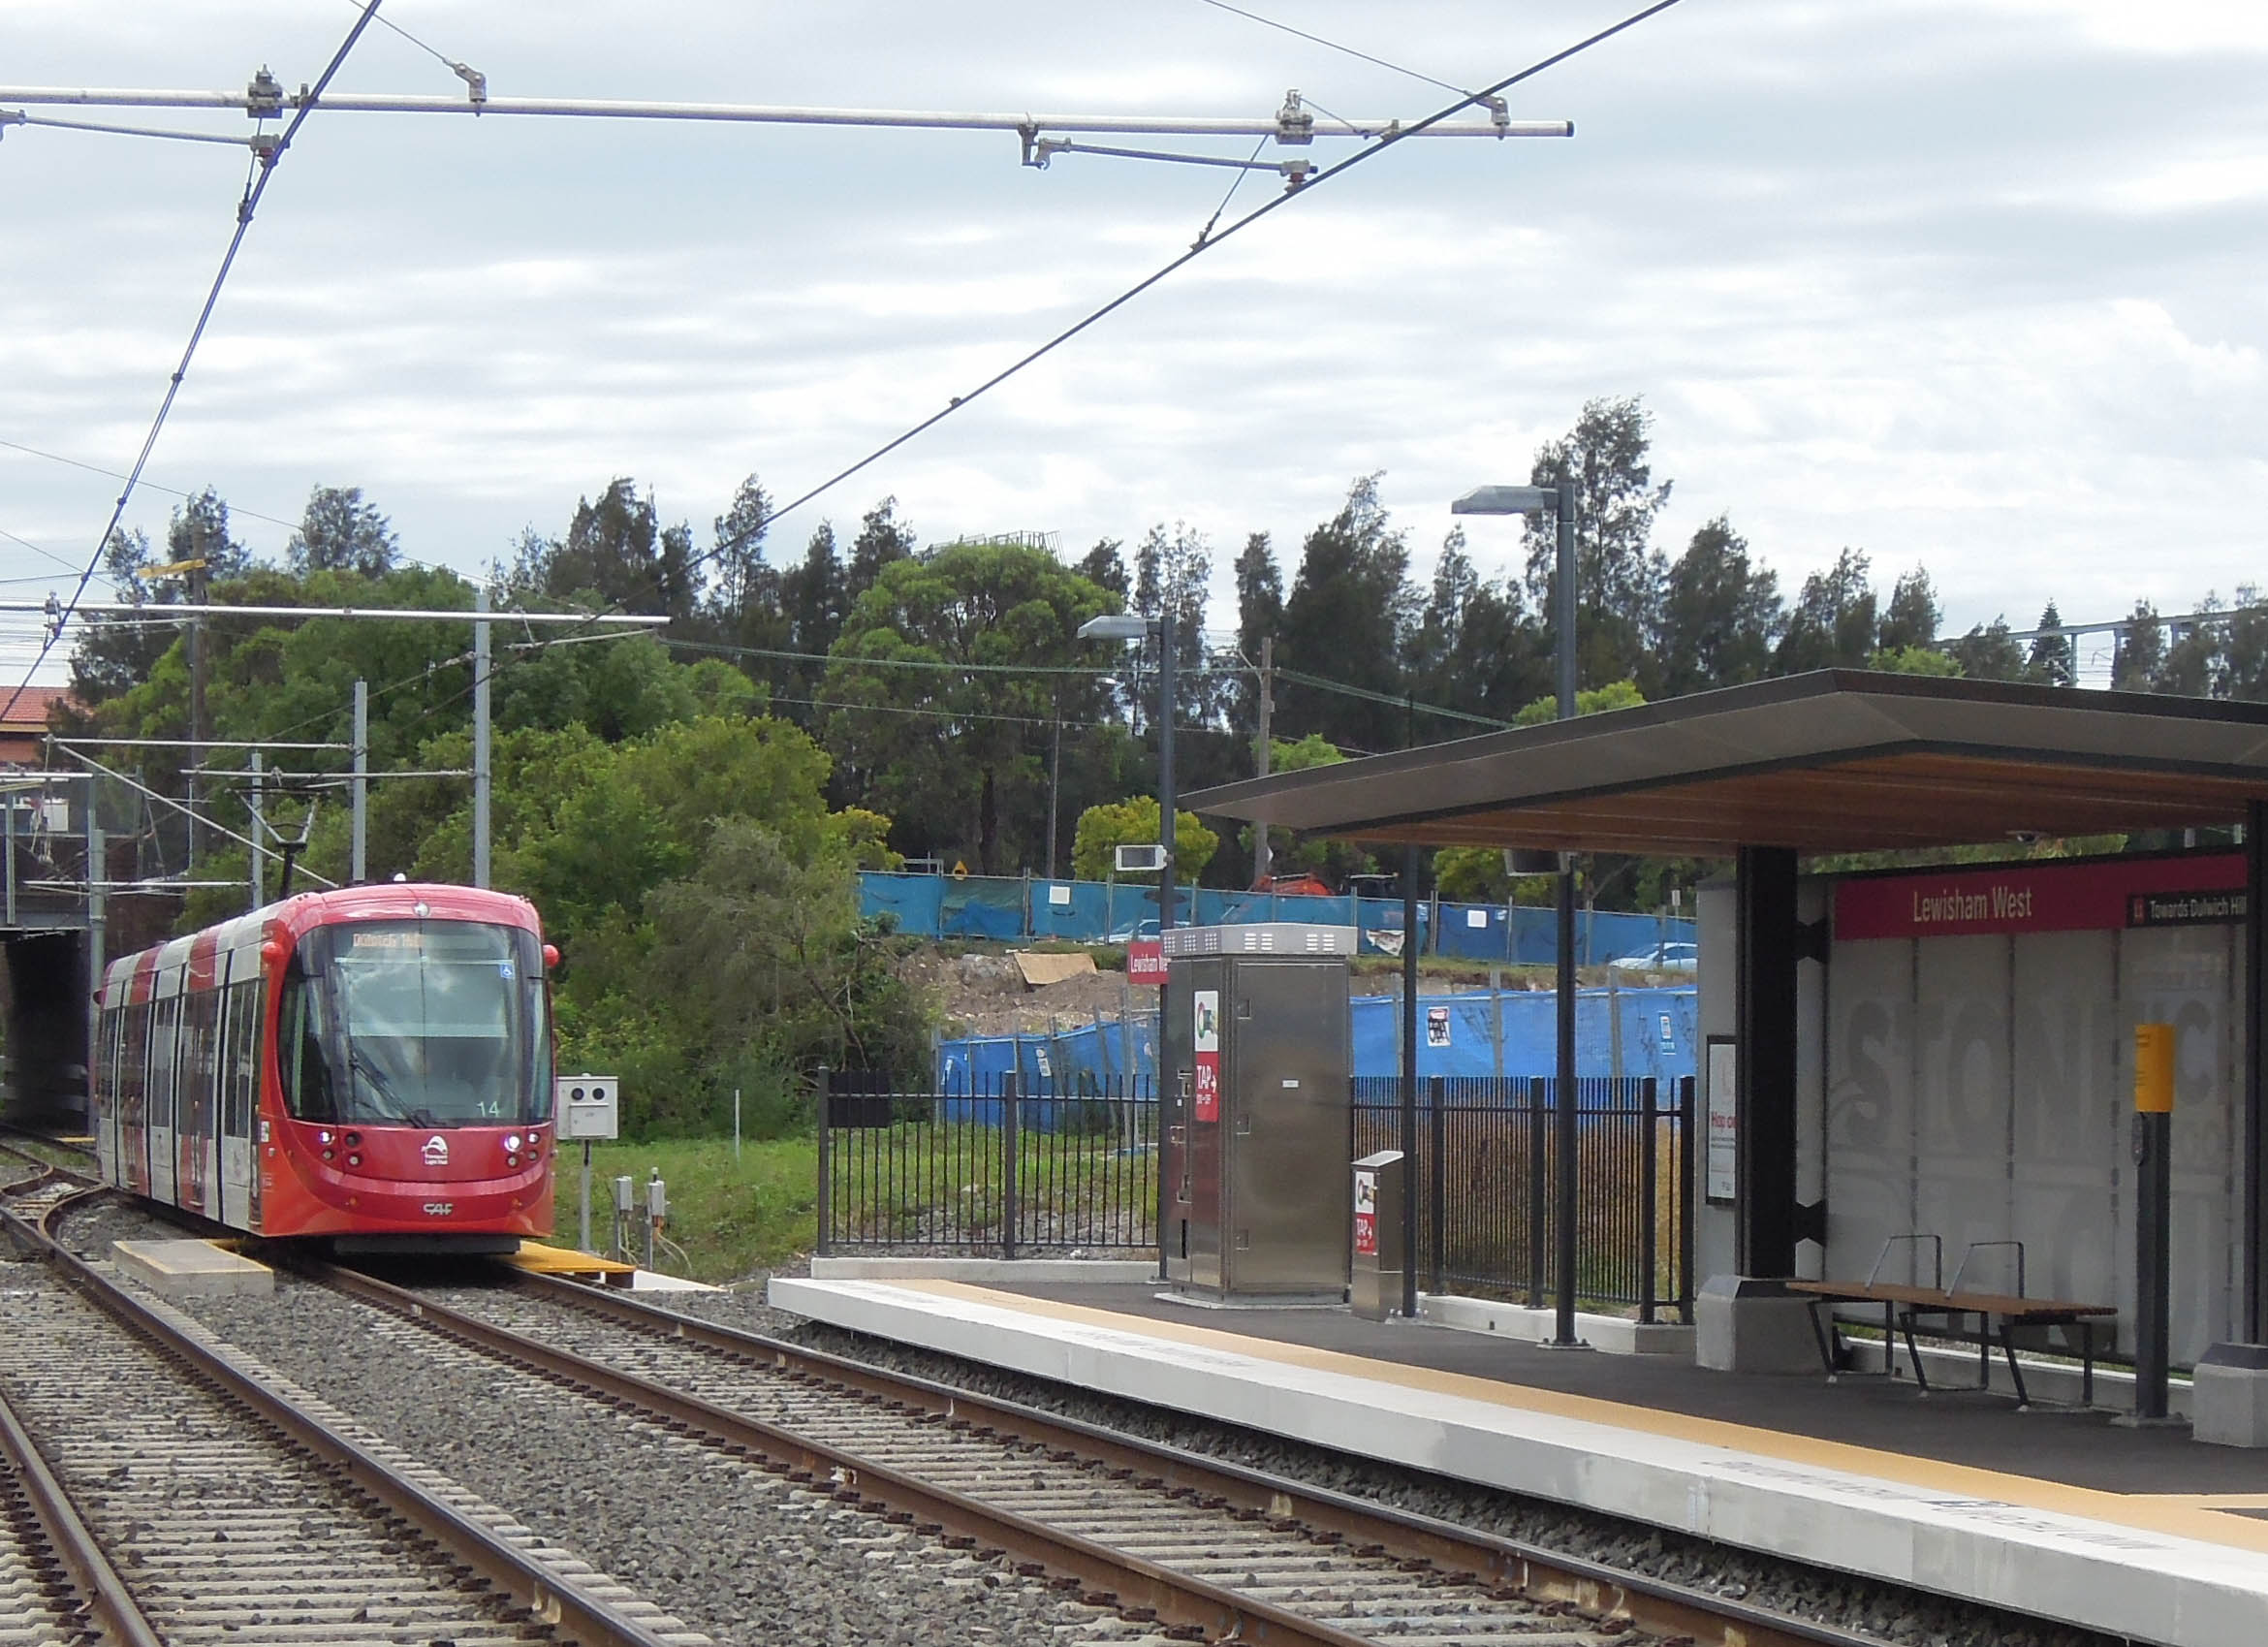
Sydney’s Dulwich Hill Light Rail (author’s photo)
Number of stations/stops and the distance between them: As well as being the longest and oldest system, Adelaide’s light rail line has the most stops (28) and the shortest average distance between them (556 metres). Both the current and planned lines in Sydney are roughly similar in stop spacing to Adelaide (23 stops at an average 582 metres apart and 19 stops 667 metres apart, respectively).
The Gold Coast line and the one planned for Canberra have distinctly different stopping patterns compared to the other three lines. The Gold Coast system has 16 stops an average of 867 metres apart, while the planned Capital Metro will have only 13 stops an average 1,000 metres apart.
It should be noted however that both these systems have long stretches without any stops, which is one of the reasons that any comparisons based on average distances between stops need to be treated with some caution. Nonetheless the number of stops and the average distance between them obviously has an impact on trip speeds and journey times. Consequently there seems to be an overall trend towards fewer, more widely spaced stops in newer systems partly to reduce journey times (which will be considered in the next post), though this has interesting ramifications for station catchments.
Interchanges: All current and planned lines have multiple interchanges with buses, while only the planned CESLR in Sydney will have a ferry interchange. The Adelaide line has one rail interchange while Sydney’s Dulwich Hill line has two (one at each end). Each of these lines also has another stop which is not formally regarded as an interchange but which is a few hundred metres away from a railway station. The planned CESLR in Sydney will have four rail interchanges but these will be all along the CBD section where the line runs close to the City Circle railway corridor.
There are no rail interchanges currently on the Gold Coast line, though most of the extension options proposed involve making such a connection. Canberra has no heavy rail services apart from the interstate line. When Sydney’s CESLR is completed there will be the only light rail to light rail interchange where this line crosses the Dulwich Hill line in Sydney’s CBD.
Fleet statistics: Apart from the heritage trams in Adelaide and the Variotrams being phased out in Sydney, the entire Australian light rail fleet is less than 10 years old. Three manufacturers – Alstom, Bombardier and CAF – have supplied all the vehicles, which are wholly or predominantly low-floor. The capacity of each LR vehicle ranges from around 180 passengers in Adelaide to 300 on the Gold Coast, though these figures have to treated with some caution because of the different ways in which manufacturers and system operators handle the calculation of standing passenger numbers.
The planned CESLR in Sydney will have the highest capacity in terms of passenger numbers per service as the LR vehicles there will be run in coupled pairs which will be able to carry a total of around 450 people. This line will also have the largest fleet, with 30 LR vehicles.
Costs: The table shows the total cost and the cost per kilometre for lines and sections of lines opened since January 2010. Any comparison of these figures has to be made with some caution as it is difficult to establish a consistent approach regarding what infrastructure and other components are included and excluded.
Broadly speaking however, there are two sets of comparisons that can be made. The first is between the extensions to existing lines (the Dulwich Hill line in Sydney and Adelaide’s Glenelg line) and the second is between the brand new systems recently constructed in the Gold Coast and planned for Sydney and Canberra.
In relation to the systems that have been extended, the cost per kilometre is broadly similar, at $31.4 million and $33.6 million in Sydney and Adelaide respectively. While this makes the Sydney extension the cheapest it had the advantage of utilising an existing rail corridor and heavy rail infrastructure, while the Adelaide extensions have involved laying new track on busy CBD roads.
All the new lines current and proposed are considerably more expensive both in total and on a per-kilometre basis. This is not surprising as the total cost of a new line is likely to include rolling stock, depots and other supporting infrastructure not required for extensions, though as noted earlier it is difficult to know which specific items are actually included. This is a particular issue in projects such as Sydney’s CESLR where there are associated works such as converting CBD streets to pedestrian malls.
Another issue is that as only one of the new systems, the Gold Coast line, has actually been constructed the other costs quoted in the table for Sydney’s CESLR and the Capital Metro in Canberra are still estimates. Bearing this in mind, there is still a very wide range in the costings. The Gold Coast line cost a total of $1.6 billion and $123 million per kilometre to build. Sydney’s planned CESLR will be the most expensive line at an estimated $2.1 billion or $175 million per kilometre while the planned line in Canberra will be the cheapest at an estimated $823 million or $68.6 million per kilometre.
There are a number of factors which are likely to have contributed to these cost differences. For example, it is not surprising that Sydney’s system will be the most expensive to construct, given the complexities of building light rail through the narrow and congested streets of the city’s CBD and the additional features involved in this build, including the cost of converting George Street to a pedestrian mall in which the light rail line will be wire-free and the construction of a short tunnel segment.
This system will also have the biggest vehicle fleet, though it is still somewhat surprising that this system will cost $52 million a kilometre more than the Gold Coast line. The cost differential between the construction cost of the Gold Coast line and the estimate for the propsed Canberra line which is nearly 50% cheaper per kilometre is also hard to explain, though it would appear that the Canberra system will present fewer technical challenges given wide roadways and median strips along the planned route.
Cost benefit: The cost-benefit ratio (CBR) is the ratio of a project’s actual or estimated costs to the value of its benefits. A CBR of 1.0 indicates that the costs and benefits are equal while a number larger than 1.0 suggests that the benefits will outweigh the costs.
There are a number of different ways of calculating the CBR of a project which will also vary as it progresses and estimates of costs and benefits change. I have used published CBRs (none was available for Adelaide) but have adjusted these where the cost estimates have subsequently varied or where the final actual project cost was different to that used in the CBR calculation. It has not been possible however to account for variations in the level of benefit, for example in situations where patronage numbers vary from initial forecasts.
On this basis the lines with the lowest CBR are the Dulwich Hill line in Sydney (a CBR of 1.0) and the line planned for Canberra (1.2). The Gold Coast line has a CBR of 1.65 while the proposed CESLR line in Sydney has a ratio of 1.9. It should be noted however that passenger numbers on all the existing lines have exceeded forecasts so it is likely that the actual CBRs are more favourable for these projects.
In the final post in this series I will review the actual and planned performance of these lines, outline the options for their expansion and provide some comments about these systems and light rail development in Australia generally.

Pingback: A tale of three light rail lines (and two to come) – part 3: performance, expansion and concluding comments | StrategicMatters
Pingback: A tale of three light rail lines (and two to come) – part 1 | StrategicMatters
If you look at the per square meter cost of building these tramways, and compare that to the per square metre cost of building a house, one might be tempted to ask why it is many more times expensive to build a slab with rails and reinforcement, than it is to build a block of apartments on top of a slab with reinforcement.
I do suspect we are being taken for a very expensive ride.
LikeLiked by 1 person
Hi Mark,
Yes, I agree – the costs of infrastructure in Australia and in particular Sydney remain a complete mystery to me. Not sure if you’re aware of the work Gavin Gatenby has done around this, like this video trying to explain why this has happened: http://ecotransit-votes.info/?page_id=7 Even after watching this however I’m still unclear how this situation has occurred in NSW.
LikeLike
Pingback: What happened in StrategicMatters in 2015? | StrategicMatters